Metrics
Several numbers in a grid, with their changes.
Before and after
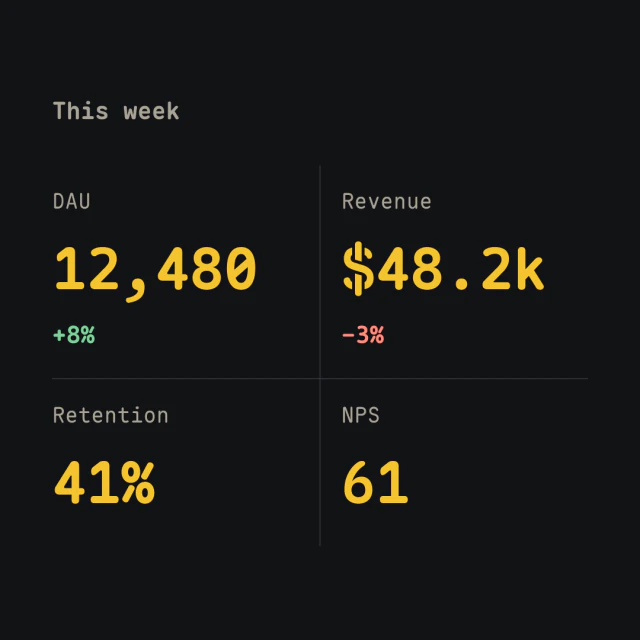
This week
DAU: 12,480 (+8%)
Revenue: $48.2k (−3%)
Retention: 41%
NPS: 61
Have Peesuto? Copy the sample, then press ⌥V in any text field to get this card.
Pasted with ⌥V ↩
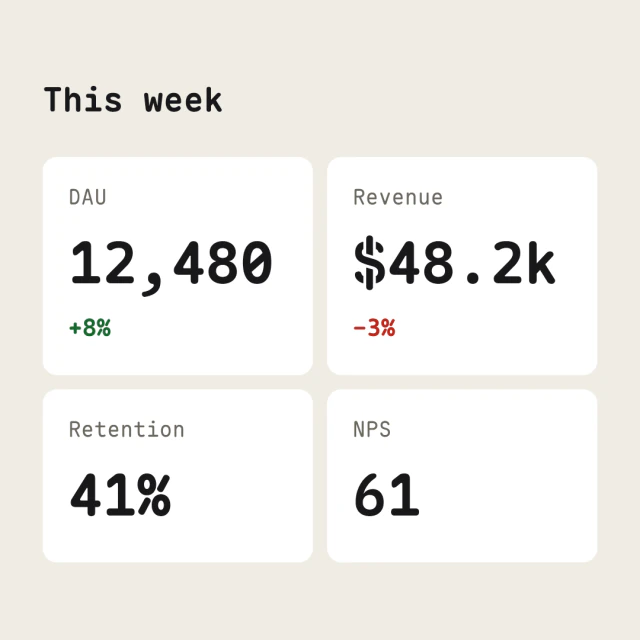
2 styles
Switch after pasting, or pick a default in Settings › Templates.
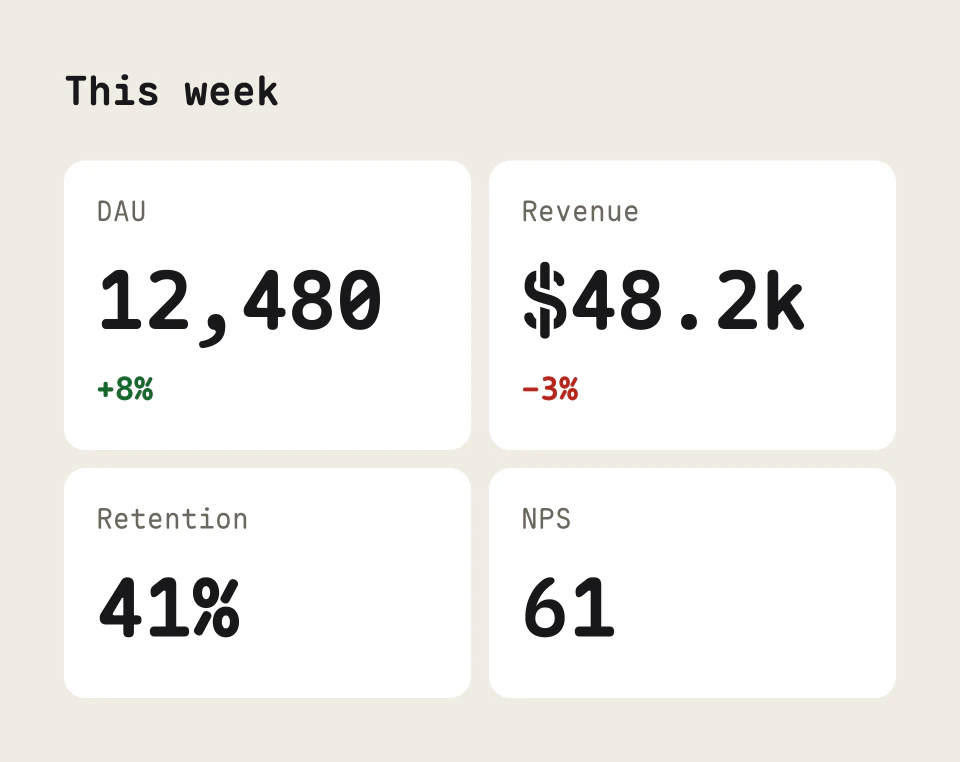
Square or wide
Images fit their content by default; choose 1:1, 4:5, 16:9 or 9:16 for any output. Content that does not fit a fixed frame grows the image, or scrolls in a GIF or video; nothing is cut.
In motion
Press G in the chooser for a GIF or M for an MP4: the same card, revealed in reading order. The video needs ffmpeg on your Mac.
How Peesuto recognises it
An optional title, then two to twelve “label: value” lines where every value is a number, optionally with a change such as +8% or (−3%). Rises are green, falls red.
The exact rules are in docs/templates.md.